Configure the Armory Splunk App for Spinnaker
Advantages to using the Armory Splunk application
The Armory Splunk App for Spinnaker™ brings all the SDLC information your organization has into a digestible and familiar format, Splunk dashboards. Connect Splunk to Armory Enterprise for Spinnaker with the Armory Splunk App for Spinnaker. See information like your top deployment artifacts and user information in Splunk. If you would like more information about the data that Spinnaker feeds into Splunk, watch the video walkthrough at the bottom of this page.
Install the Armory Splunk App for Spinnaker
- Go to the Splunk App store (Splunkbase) and download the “Armory Splunk App for Spinnaker”
- Search for “Armory” or “Spinnaker.”
- Install the “Armory Splunk App for Spinnaker” on the Search Head, Indexer, or in the “/etc/master-apps/” directory on the master for Search Head Clustering.
- The TA can be installed on the Indexers, Heavy Forwarders, or all in one Splunk. It’s the data input, so install based on your Splunk architecture.
Configure Splunk HTTP Event Collector Endpoint to recieve data from Spinnaker
To start we’ll configured Splunk to recieve authenticated data flow from Spinnaker. This configuration is similar to any other HTTP Event Collector.
Perform the following steps:
- Configure Splunk to have a new Data Input. In the top right of the Splunk UI, select Settings > Data Inputs.

- Locate the HTTP Event Collector and click the + Add New.

- Under the Name field, give the input a name, such as “Spinnaker” and click Next.
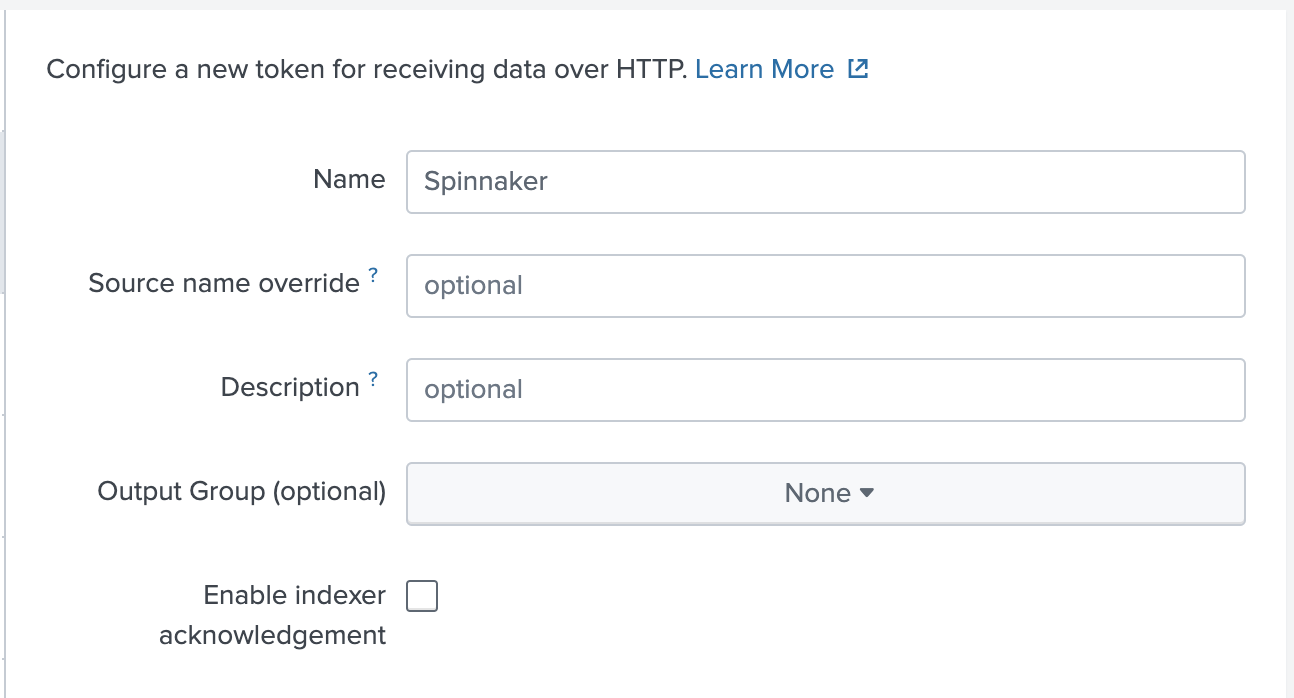
- Select the following configurations:
- Source type: Select Automatic since given the data source is JSON and parsed by default.
- App context: Select Armory (TA-armory).
- Index: Select “armory” as the index for storing the data in Splunk. Click the “Review” button at the top.
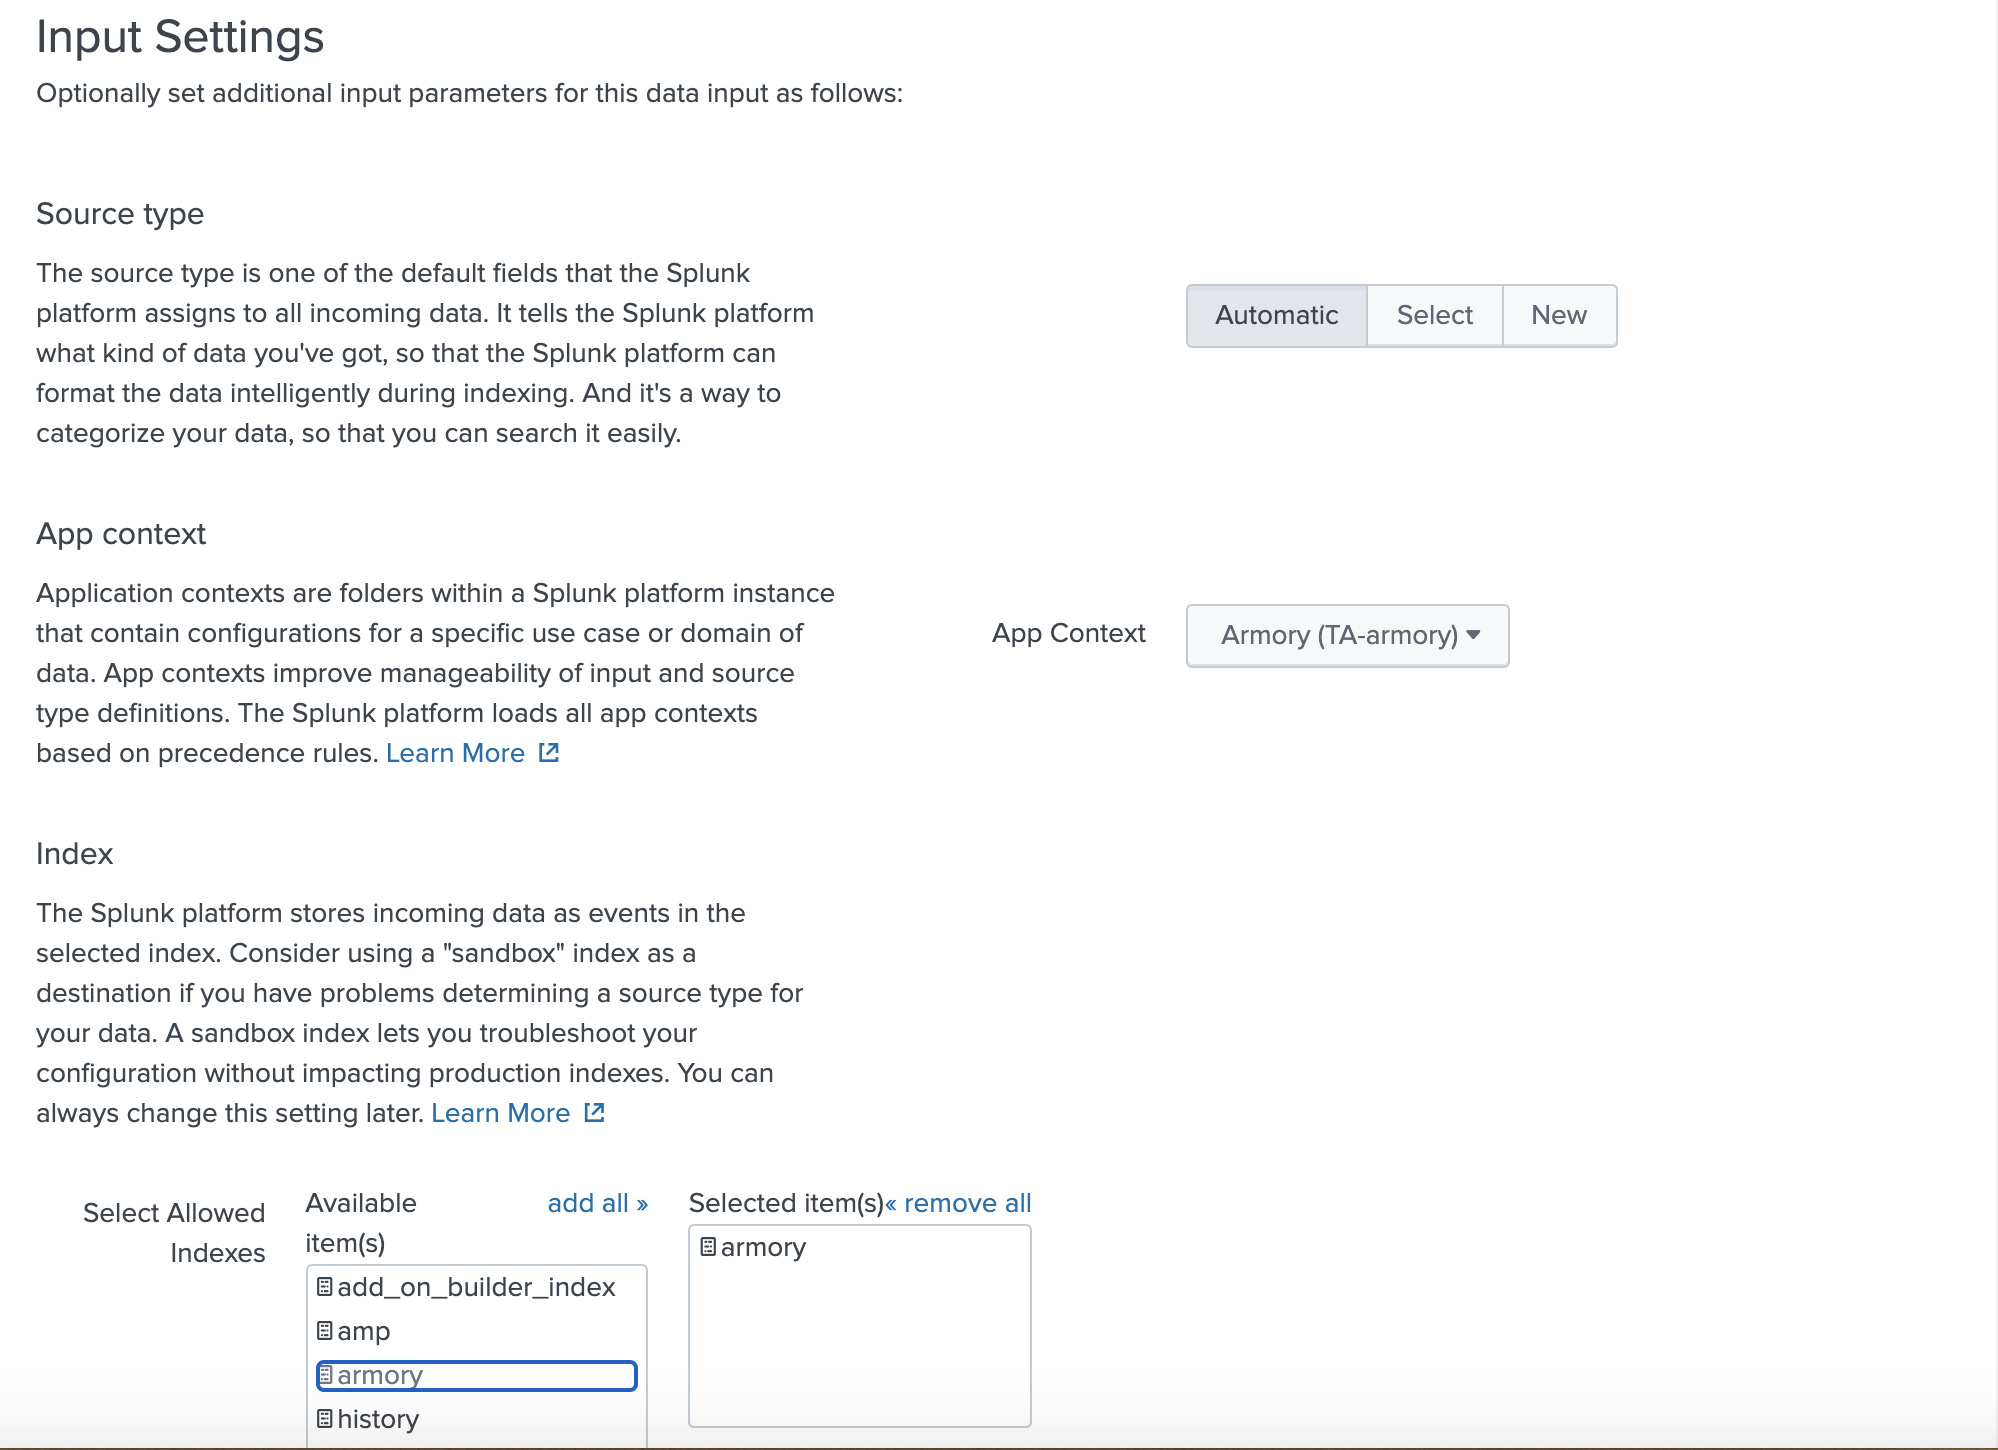
- Configure the HTTP Event Collector Data Input for Spinnaker and click Submit.

You will see that Splunk successfully created the new data input, and the authentication token for the HTTP event collector is generated. Keep this token and store it for the Spinnaker configuration. You can always view the HTTP Event Collector Data Inputs and find the authentication token there..
Forward data to the Splunk HTTP Event Collector
This section describes how to forward data to Splunk so that you can see data from Spinnaker in your Splunk dashboard. Based on how you deployed Spinnaker, see Halyard or Operator.
Halyard configuration
- Login to your Halyard pod. This can be running standalone, in your Kubernetes cluster, or as a part of Minnaker (Spinnaker in a VM).
- Navigate to the
~/.hal/default/profilesdirectory inside of Halyard file system. - If one does not already exist, create a
echo-local.ymlfile to apply configuration to the Spinnaker’s Echo service. This can be done with any plain text editor, such as VI. - Insert the following config into
echo-local.yml:rest: enabled: true endpoints: - wrap: true url: "https://<Your-HTTP-Event-Collector-Hostname>:8088/services/collector/event?" headers: Authorization: "Splunk <Your-HTTP-Event-Collector-Token>" template: '{"event":{{event}} }' insecure: trueMake the following changes:
url: Replace<Your-HTTP-Event-Collector-Hostname>with the IP or Hostname of your configured HTTP Event Collector.Authorization: Replace<Your-HTTP-Event-Collector-Token>with the token generated from the Splunk HTTP Event Collector configuration.
- Save the file.
- Run
hal deploy applywithin the Halyard container to apply the new Echo configuration.
Once the Spinnaker services that need the configuration change restart, Spinnaker data starts to flow to the HTTP Event Collector and indexed in the “armory” index.
Operator configuration
Insert this YAML into your SpinnakerService.yml file, or use it as a patch file if you use Kustomize to build SpinnakerService.yml:
apiVersion: spinnaker.armory.io/v1alpha2
kind: SpinnakerService
metadata:
name: spinnaker
spec:
spinnakerConfig:
profiles:
echo:
rest:
  enabled: true
  endpoints:
  - wrap: true
    url: "https://<Your-HTTP-Event-Collector-Hostname>:8088/services/collector/event?"
    headers:
      Authorization: "Splunk <Your-HTTP-Event-Collector-Token>"
    template: '{"event":{{event}} }'
    insecure: true
Make the following changes:
url: Replace<Your-HTTP-Event-Collector-Hostname>with the IP or Hostname of your configured HTTP Event Collector.Authorization: Replace<Your-HTTP-Event-Collector-Token>with the token generated from the Splunk HTTP Event Collector
Once the Spinnaker services that need the configuration change restart, Spinnaker data starts to flow to the HTTP Event Collector and indexed in the “armory” index.
Verify the connection
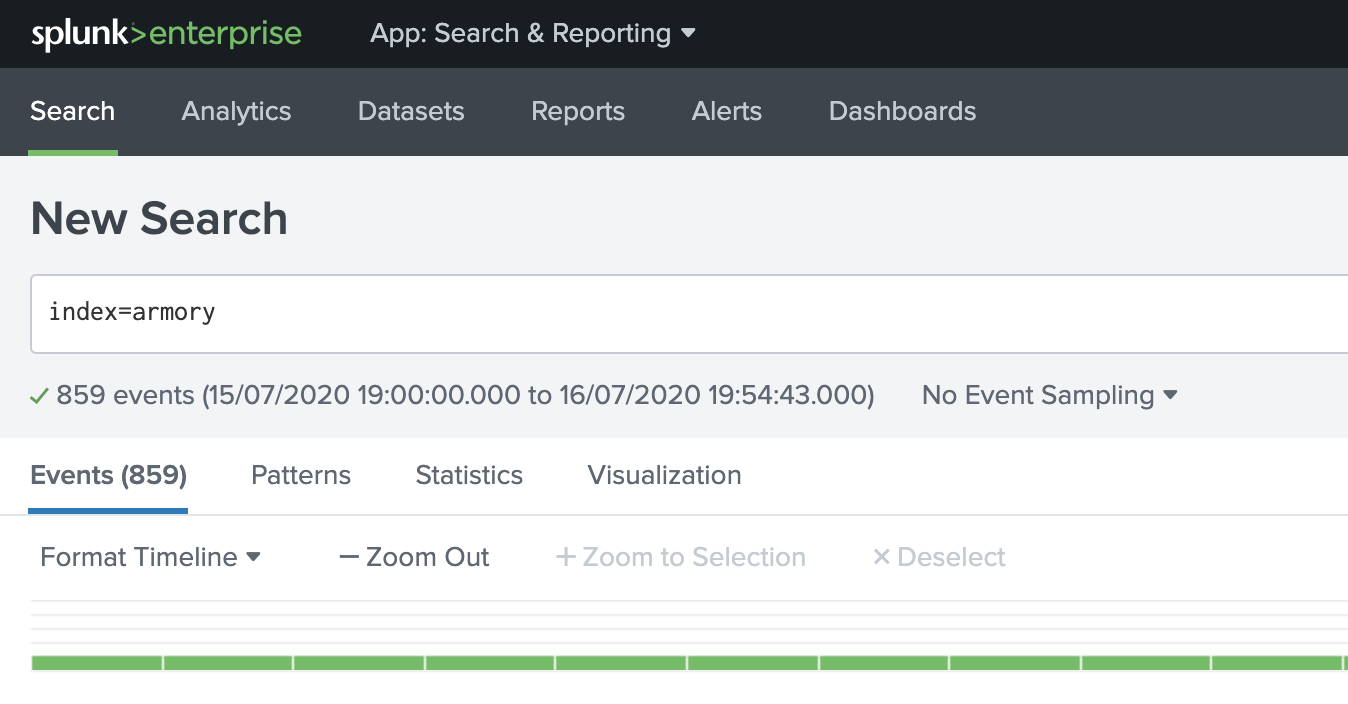
You can verify that events are flowing from Spinnaker to Splunk by performing a search for index=armory in the Spunk UI.
Configure Automated Rollback with Splunk and Spinnaker
The Armory Splunk App for Spinnaker includes a Splunk webhook for data driven automated rollback. You can configure this webhook to the Spinnaker API.
-
Select the Spinnaker App in the Splunk UI.
-
Click on Settings > Searches, reports and alerts and locate the Rollback Alert.

-
Select Action > Edit > Edit Alert.

-
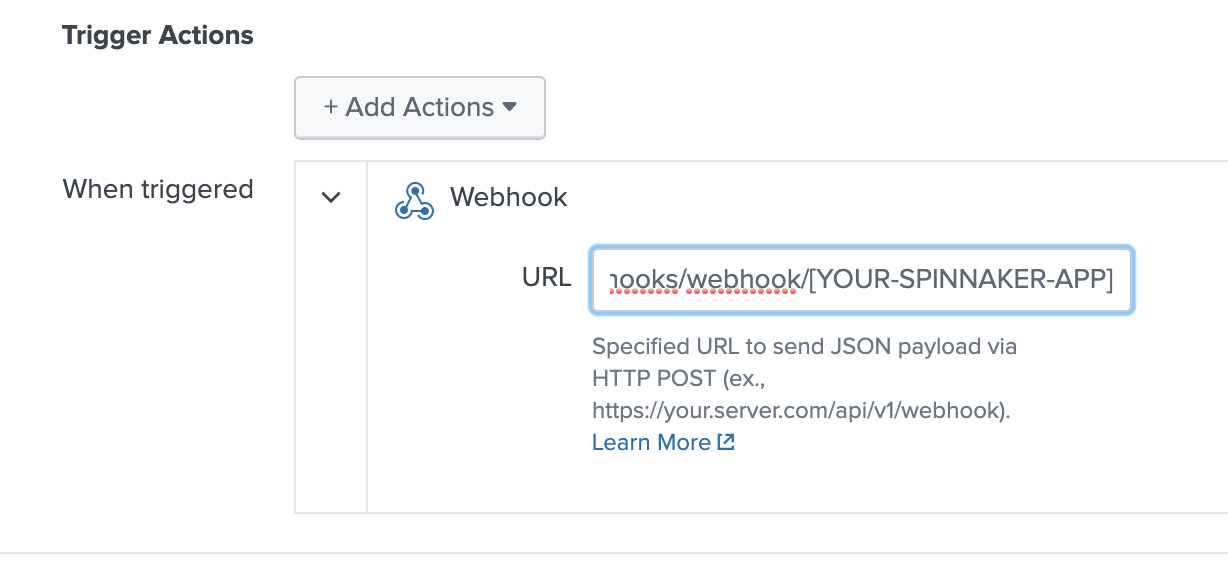
Find the Trigger Actions section.
-
Under Webhook > URL, insert the following URL:
https://<YOUR-GATE-HOSTNAME>/api/v1/webhook/<YOUR-SPINNAKER-APP>- Replace the
<YOUR-GATE-HOSTNAME>with the fully qualified domain name or IP of your Spinnaker Gate service.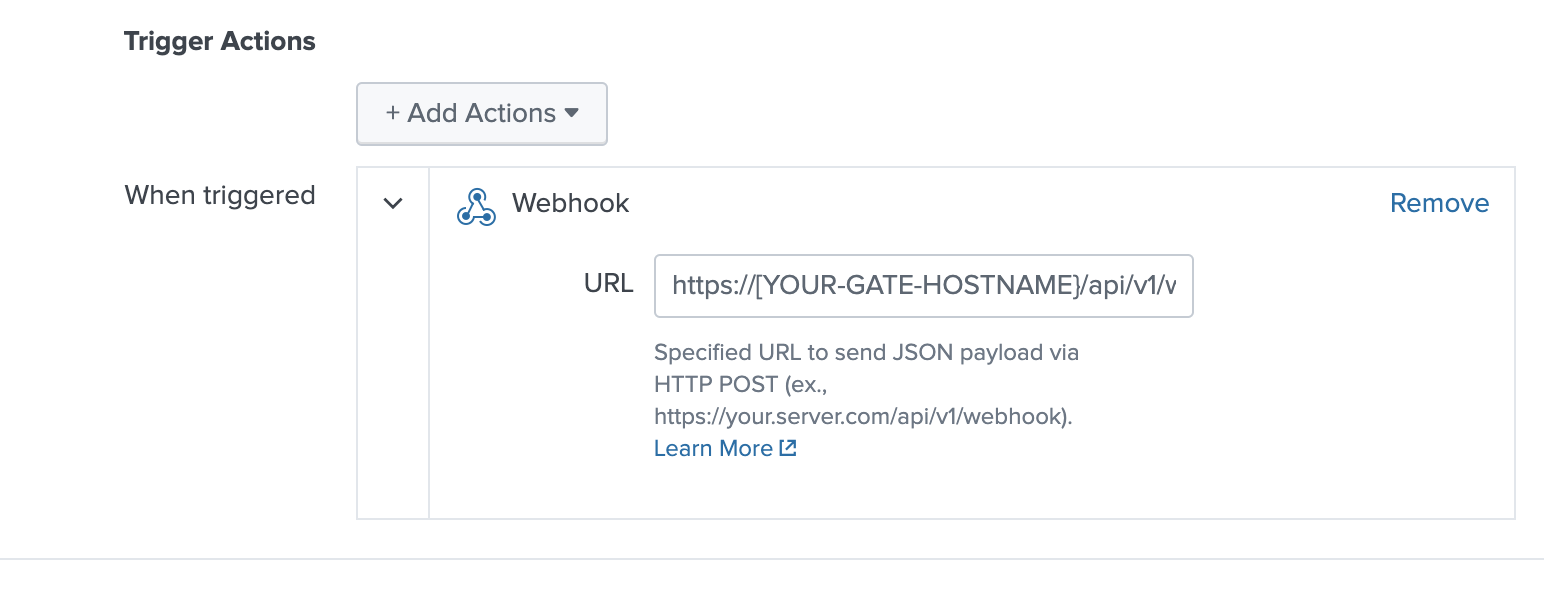
- Replace the “[YOUR-SPINNAKER-APP]” with the Spinnaker Application you’d like to Rollback based on Errors, Exceptions, or KPI’s from Splunk.
- Replace the
Video Walkthrough
Feedback
Was this page helpful?
Thank you for letting us know!
Sorry to hear that. Please tell us how we can improve.
Last modified April 12, 2021: (8405118)